
Physics - Heat & Thermo Question with Solution | TestHub
PhysicsHeat & ThermoKinetic Theory of Gases and Gas LawsMedium2 minQB
PhysicsMediumsingle choice
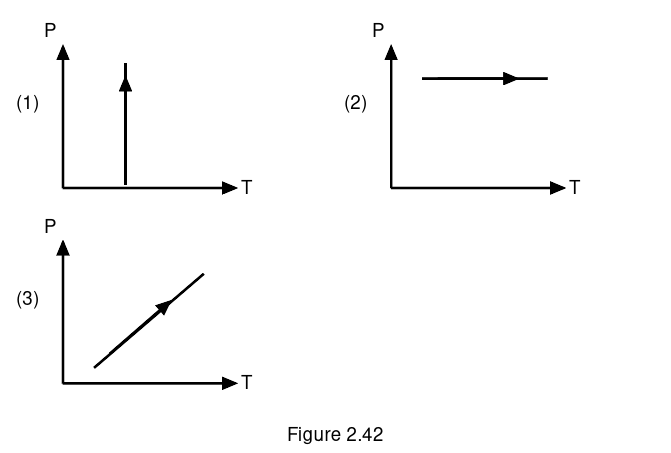
P-T graphs of an ideal gas are shown in Figure 2.42. Choose the wrong statement from the options given.
Options:
Answer:
D
Solution:
Graph (1) is a vertical line, so P rises at constant T, the volume falls and the density rises. Graph (2) is a horizontal line, so T rises at constant P, the volume rises and the density falls. Graph (3) is a straight line through the origin, so (P)/(T) is constant, the volume is constant and so is the density. All three statements are right. D.
Subject:PhysicsTopic:Heat & ThermoSubtopic:Kinetic Theory of Gases and Gas Laws
⏱ 2mℹ️ Source: QB
Doubts & Discussion
Loading discussions...
