
Physics - Kinematics Question with Solution | TestHub
PhysicsKinematicsMiscellaneousMedium2 minQB
PhysicsMediumsingle choice
A particle starts from rest and moves as shown in the acceleration-time graph (figure-1.104): for the first 2 s and for the next 2 s. The correct velocity-time graph for the interval of 4 seconds is:
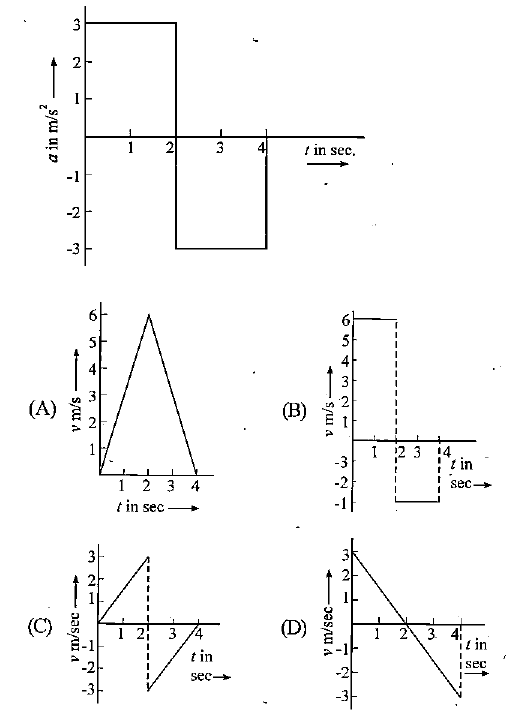
Options:
Answer:
A
Solution:
The velocity increases linearly from 0 to during the first 2 s (constant positive acceleration) and then decreases linearly, reaching zero at s. Only graph (A) shows this symmetric triangle. Option A.
Stream:JEESubject:PhysicsTopic:KinematicsSubtopic:Miscellaneous
⏱ 2mℹ️ Source: QB
Doubts & Discussion
Loading discussions...
