
Physics - Kinematics Question with Solution | TestHub
PhysicsKinematicsMiscellaneousMedium2 minQB
PhysicsMediumsingle choice
The force acting on a particle moving along a straight line varies with time as shown in figure-1.108: it rises linearly to a maximum and then falls linearly to zero, always parallel to the velocity. Which graph is the best representative of its speed-time graph?
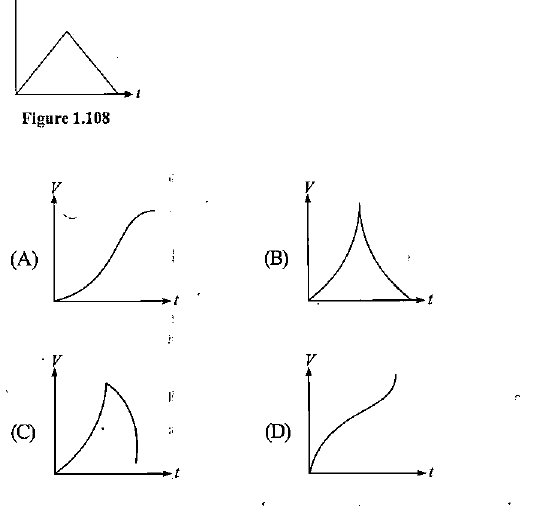
Options:
Answer:
A
Solution:
The acceleration (slope of the - curve) increases for the first half of the time and decreases for the second half, finally becoming zero, so the - curve becomes steeper up to half time, then flatter, and finally horizontal. Only graph (A) shows this S-shape flattening out. Option A.
Stream:JEESubject:PhysicsTopic:KinematicsSubtopic:Miscellaneous
⏱ 2mℹ️ Source: QB
Doubts & Discussion
Loading discussions...
