
Physics - Heat & Thermo Question with Solution | TestHub
PhysicsHeat & ThermoKTGMedium2 minQB
PhysicsMediumsingle choice
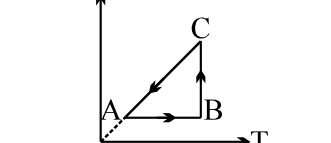
Figure shows V-T graph of a cyclic process. Which of the following P-V graph represents the same process?
Options:
Answer:
C
Solution:
: , isobaric expansion. : isochoric pressure rise. : isothermal compression. Only option (C) shows isobaric volume rise, then isochoric pressure rise, then curved isothermal return.
Stream:JEESubject:PhysicsTopic:Heat & ThermoSubtopic:KTG
⏱ 2mℹ️ Source: QB
Doubts & Discussion
Loading discussions...
