
Physics - Heat & Thermo Question with Solution | TestHub
PhysicsHeat & ThermoThermodynamicsMedium2 minQB
PhysicsMediumsingle choice
Passage / Comprehension
A sample of ideal gas is taken through the cyclic process shown in the figure. The temperature of the gas at state A is K. At states B and C the temperature of the gas is the same.
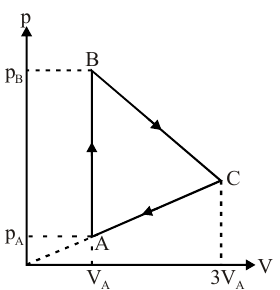
Which of the following graphs best represents the cyclic process in a T-V diagram?
Options:
Answer:
D
Solution:
AB is isochoric: a vertical segment in the T-V diagram.
BC: falls linearly as grows, so rises to a maximum partway, then falls - a curved arc.
CA: curved return with falling to ; only graph (D) has the vertical AB segment and correctly sensed arcs.
Stream:JEESubject:PhysicsTopic:Heat & ThermoSubtopic:Thermodynamics
⏱ 2mℹ️ Source: QB
Doubts & Discussion
Loading discussions...
