
Physics - Heat & Thermo Question with Solution | TestHub
PhysicsHeat & ThermoKTGMedium2 minQB
PhysicsMediumsingle choice
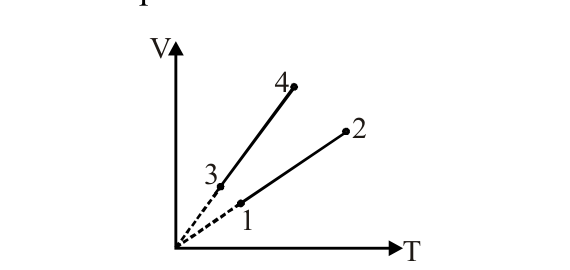
Volume versus temperature graph of samples of an ideal gas is plotted as shown in figure. Choose the correct alternative. The samples have same number of moles but may have different pressures.
Options:
Answer:
B
Solution:
A straight line passing through the origin in a V-T graph represents an isobaric process. slope . Lines 1, 2 share one slope and lines 3, 4 share a smaller slope, so .
Stream:JEESubject:PhysicsTopic:Heat & ThermoSubtopic:KTG
⏱ 2mℹ️ Source: QB
Doubts & Discussion
Loading discussions...
