Physics - NLM Question with Solution | TestHub
PhysicsNLMSimple Application of NLMEasy2 minPYQ_2023
PhysicsEasysingle choice
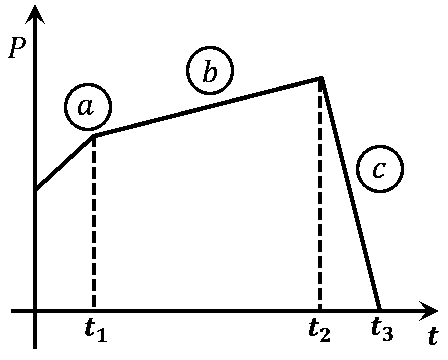
The figure represents the momentum time curve for a particle moving along an axis under the influence of the force. Identify the regions on the graph where the magnitude of the force is maximum and minimum respectively ?
If
Options:
Answer:
C
Solution:
From Newton's second,
From the given graph, we can see that slope of region is maximum and slope of region is minimum.
Thus, .
Stream:JEESubject:PhysicsTopic:NLMSubtopic:Simple Application of NLM
⏱ 2mℹ️ Source: PYQ_2023
Doubts & Discussion
Loading discussions...