
Physics - Kinematics Question with Solution | TestHub
PhysicsKinematicsMiscellaneousMedium2 minQB
PhysicsMediumsingle choice
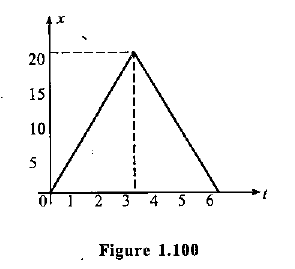
For the displacement-time graph shown in the figure, the ratio of the speeds during the first two seconds and the next four seconds is:
Options:
Answer:
A
Solution:
The graph is a single straight line rising to s and a straight line falling after; the magnitude of the slope is the same () throughout the first two seconds and the next four seconds. Speed ratio = . Option A.
Stream:JEESubject:PhysicsTopic:KinematicsSubtopic:Miscellaneous
⏱ 2mℹ️ Source: QB
Doubts & Discussion
Loading discussions...
