
Physics - Heat & Thermo Question with Solution | TestHub
PhysicsHeat & ThermoCalorimetryMedium2 minQB
PhysicsMediumsingle choice
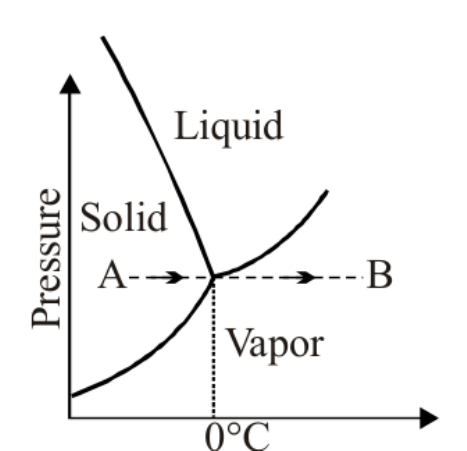
The phase diagram for water is shown in figure. If the temperature of a certain amount of ice is increased by following the path represented by the dashed line from A to B in the phase diagram, which of the graphs of temperature as a function of heat added is correct? Treat water vapour as an ideal gas.
Options:
Answer:
B
Solution:
The path A to B passes through the triple point at constant low pressure.
Ice first warms up to .
At the triple point ice changes directly into vapour (sublimation), so the temperature stays at during this change.
No liquid phase appears. Afterwards the vapour is heated, and the temperature rises steeply since vapour has a small specific heat.
This matches graph (B).
Stream:JEESubject:PhysicsTopic:Heat & ThermoSubtopic:Calorimetry
⏱ 2mℹ️ Source: QB
Doubts & Discussion
Loading discussions...
