
Physics - Heat & Thermo Question with Solution | TestHub
PhysicsHeat & ThermoThermodynamics Laws & Specific Heats of GasesMedium2 minQB
PhysicsMediumsingle choice
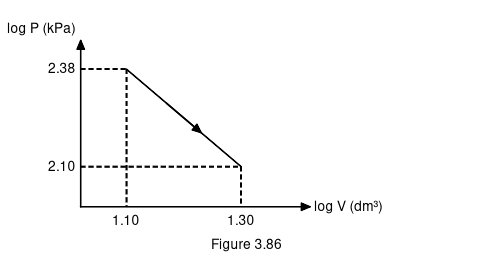
Logarithms of readings of pressure and volume for an ideal gas were plotted on the graph shown in Figure 3.86 (the line falls from to ). By measuring the gradient, it can be shown that the gas may be:
Options:
Answer:
C
Solution:
The gradient is , so . That is an adiabatic change with , a diatomic gas. C.
Subject:PhysicsTopic:Heat & ThermoSubtopic:Thermodynamics Laws & Specific Heats of Gases
⏱ 2mℹ️ Source: QB
Doubts & Discussion
Loading discussions...
