
Physics - Heat & Thermo Question with Solution | TestHub
PhysicsHeat & ThermoThermodynamicsMedium2 minQB
PhysicsMediumsingle choice
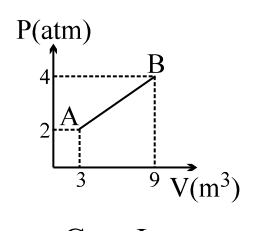
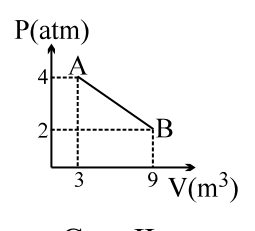
Shown in the figure are the Pressure versus Volume graphs for two processes, in each case state of a system is changed from A to B along the straight lines shown. In which case, will the heat added to the system be more?
Options:
Answer:
A
Solution:
Work (area under the straight line) is the same in both cases: . : Case I: ; Case II: . Case I has larger , hence larger and more heat added.
Stream:JEESubject:PhysicsTopic:Heat & ThermoSubtopic:Thermodynamics
⏱ 2mℹ️ Source: QB
Doubts & Discussion
Loading discussions...
