
Physics - Heat & Thermo Question with Solution | TestHub
PhysicsHeat & ThermoThermodynamics Laws & Specific Heats of GasesMedium2 minQB
PhysicsMediumsingle choice
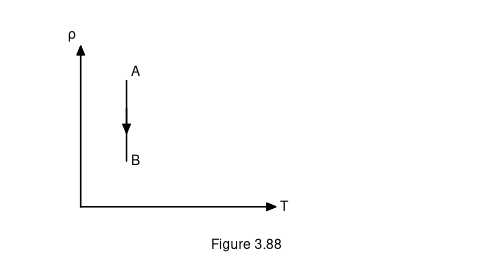
The density () versus temperature () graph of an ideal gas undergoing a process is as shown in Figure 3.88 (a vertical line from down to at fixed ). Choose the incorrect option:
Options:
Answer:
B
Solution:
is constant, so the process is isothermal and , . falls, so rises, falls () and work is positive. Option B is incorrect. B.
Subject:PhysicsTopic:Heat & ThermoSubtopic:Thermodynamics Laws & Specific Heats of Gases
⏱ 2mℹ️ Source: QB
Doubts & Discussion
Loading discussions...
