
Physics - SHM Question with Solution | TestHub
PhysicsSHMEnergyEasy2 minPYQ_2015
PhysicsEasysingle choice
For a simple pendulum, a graph is plotted between its kinetic energy (K.E.) and potential energy (P.E.) against its displacement d. which one of the following represents these correctly? (graphs are schematic and not drawn to scale)
Options:
Answer:
C
Solution:
For simple pendulum performing the simple harmonic motion, displacement,,
This represents a downward parabola,,.. This represents an upward parabola. On plotting graphs of potential energy & kinetic energy.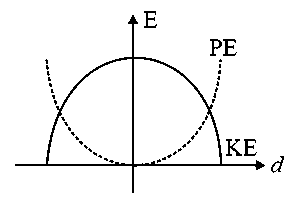
Stream:JEESubject:PhysicsTopic:SHMSubtopic:Energy
⏱ 2mℹ️ Source: PYQ_2015
Doubts & Discussion
Loading discussions...
