
Physics - Modern Physics Question with Solution | TestHub
PhysicsModern PhysicsPhotoelectric effectMedium2 minQB
PhysicsMediumsingle choice
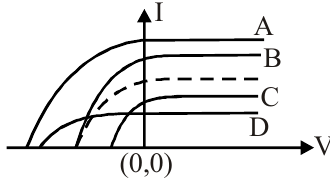
Across a photoelectric cell a source of variable potential difference is connected and the photoelectric current is plotted against the applied potential difference. The graph in broken lines represents a curve of current vs applied potential difference. If the frequency is increased and the intensity is reduced, the curve which may now represents the situation is:
Options:
Answer:
D
Solution:
Higher frequency increases stopping-potential magnitude Lower intensity reduces the saturation plateau Curve D has the more negative stopping intercept and lower plateau
Stream:JEESubject:PhysicsTopic:Modern PhysicsSubtopic:Photoelectric effect
⏱ 2mℹ️ Source: QB
Doubts & Discussion
Loading discussions...
