
Physics - Heat & Thermo Question with Solution | TestHub
PhysicsHeat & ThermoCalorimetryMedium2 minQB
PhysicsMediumsingle choice
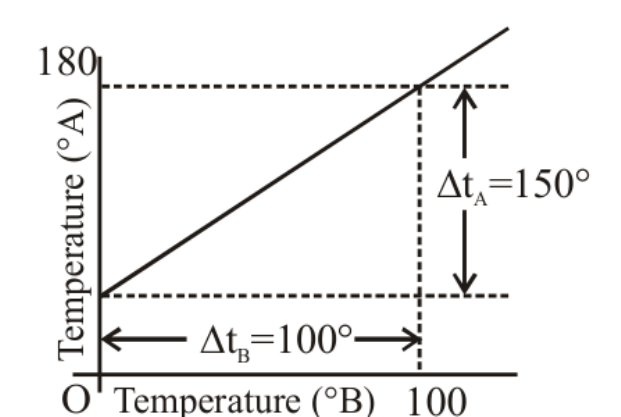
The graph between two temperature scales A and B is shown in figure. Between upper fixed point and lower fixed point there are 150 equal divisions on scale A and 100 on scale B. The relationship for conversion between the two scales is given by
Options:
Answer:
B
Solution:
From the graph, the lower fixed point is on scale A (the upper one is ) and on scale B.
Fixed-point intervals:
Stream:JEESubject:PhysicsTopic:Heat & ThermoSubtopic:Calorimetry
⏱ 2mℹ️ Source: QB
Doubts & Discussion
Loading discussions...
