
Physics - Heat & Thermo Question with Solution | TestHub
PhysicsHeat & ThermoDifferent processesMedium3 minQB
PhysicsMediummultiple choice
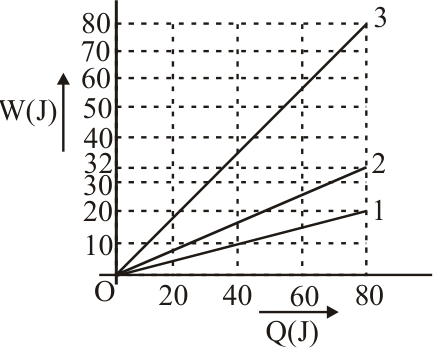
In the figure shown, the amount of heat supplied to one mole of an ideal gas is plotted on the horizontal axis and the amount of work performed by the gas is drawn on the vertical axis. One of the straight lines in the figure is an isotherm and the other two are isobars of two gases. The initial states of both gases are same. Mark the CORRECT statement(s).
Options:(select one or more)
Answer:
A, B, C, D
Solution:
(a) For the isotherm:
Curve 3 is isothermal; curves 1 and 2 are isobaric.
(b) For an isobaric process:
Here i is the degrees of freedom.
Curve 1:
Polyatomic gas.
Curve 2:
Monatomic gas.
Thus A, B, C and D are correct.
Stream:JEESubject:PhysicsTopic:Heat & ThermoSubtopic:Different processes
⏱ 3mℹ️ Source: QB
Doubts & Discussion
Loading discussions...
