
Physics - Heat & Thermo Question with Solution | TestHub
PhysicsHeat & ThermoCalorimetryMedium2 minPYQ_2013
PhysicsMediummultiple choice
The figure below shows the variation of specific heat capacity () of a solid as a function of temperature (). The temperature is increased continuously fromtoat a constant rate. Ignoring any volume change, the following statement (s) is (are) correct to a reasonable approximation.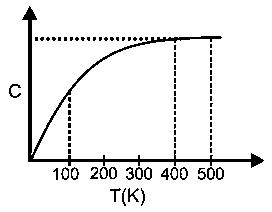
Options:(select one or more)
Answer:
A, B, C, D
Solution:
R = rate of absorption of heat
(i) in
The graph between () appears to be a straight line upto a reasonable approximation.
(ii)as C is more in () then () so heat is increasing.
(iii) C remains constant so there no change in R from ()
(iv) C is increases so R is increases in range ()
Stream:JEE_ADVSubject:PhysicsTopic:Heat & ThermoSubtopic:Calorimetry
⏱ 2mℹ️ Source: PYQ_2013
Doubts & Discussion
Loading discussions...
