
Physics - Geometrical Optics Question with Solution | TestHub
PhysicsGeometrical OpticsTIR/Prism and DispersionEasy2 minPYQ_2013
PhysicsEasysingle choice
The graph between angle of deviationand angle of incidencefor a triangular prism is represented by :
Options:
Answer:
A
Solution:
We know that angle of deviation depend upon the angle of incidence. If we determine experimentally the angle of deviation corresponding to different angles of incidence then and then plot (on -axis) and (on -axis), we get a curve as shown in figure.
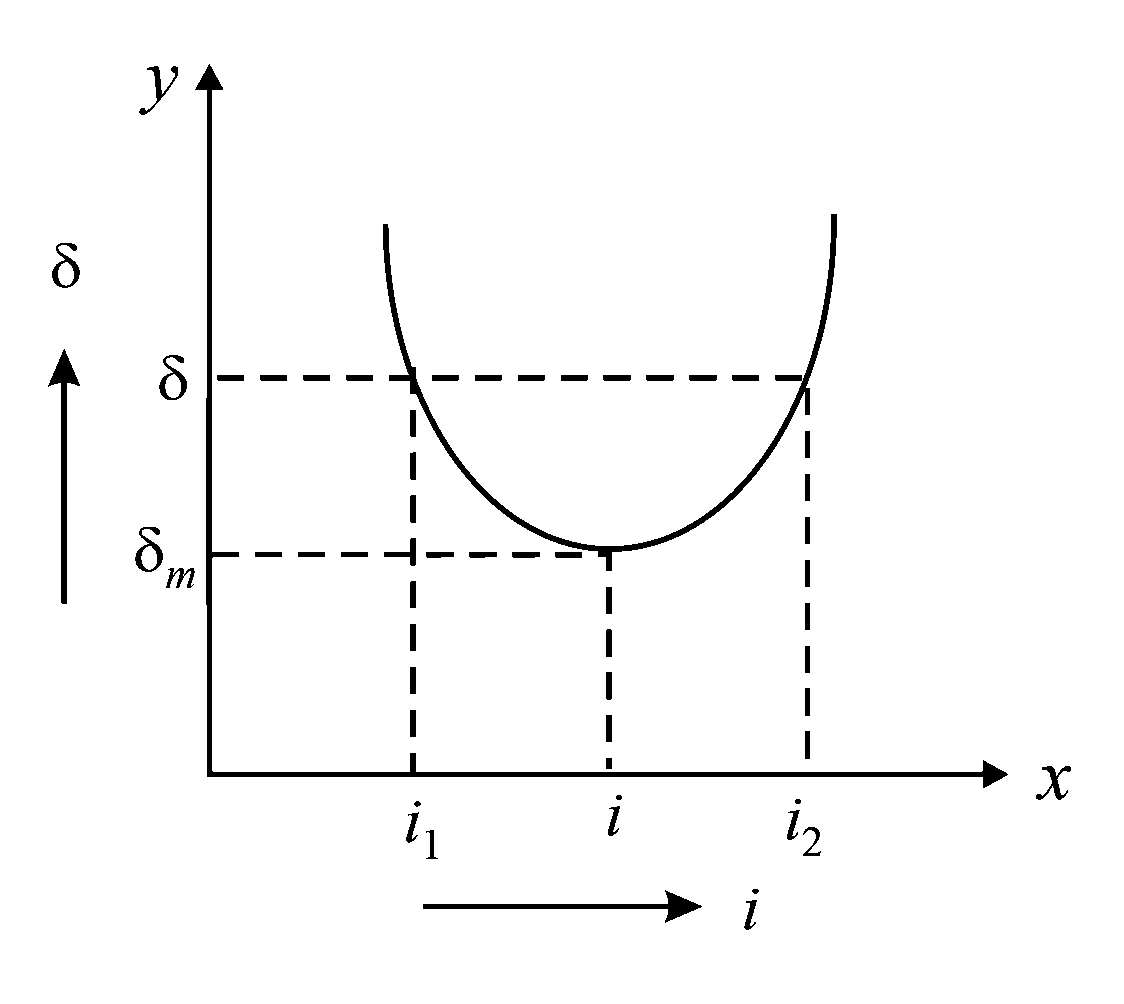
Clearly, if angle of incidence is gradually increased from a small value, the angle of deviation first decreases, becomes minimum for a particular angle of incidence and then begins to increase.
Stream:JEESubject:PhysicsTopic:Geometrical OpticsSubtopic:TIR/Prism and Dispersion
⏱ 2mℹ️ Source: PYQ_2013
Doubts & Discussion
Loading discussions...
