Physics - Fluid Question with Solution | TestHub
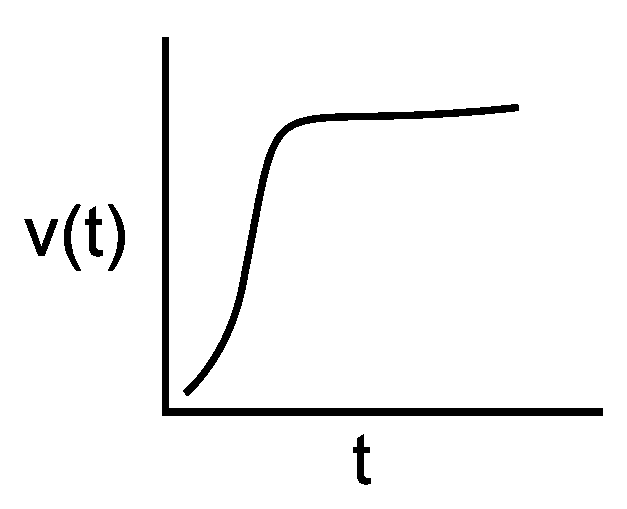
Which one of the following graphs represents the velocity-time graph of a small spherical body falling in a viscous liquid?
Options:
Answer:
Solution:
When a small spherical body falls in a viscous liquid, it experiences three forces: its weight downwards, buoyant force upwards, and viscous drag force upwards.
The equation of motion is given by:
Using Stokes' law, , the equation becomes:
This can be written in the form:
where and are positive constants.
Integrating with the initial condition at , we get:
This equation indicates that the velocity of the body initially increases with time, but the rate of increase (acceleration) continuously decreases. As , the velocity asymptotically approaches a constant maximum value known as the terminal velocity ().
The first graph correctly represents this behavior, showing the velocity increasing and eventually leveling off to a constant value.
Answer: