
Physics - Center of Mass Question with Solution | TestHub
PhysicsCenter of MassImpulse momentum theoremEasy2 minPYQ_2023
PhysicsEasysingle choice
Figures (a), (b), (c) and (d) show variation of force with time.
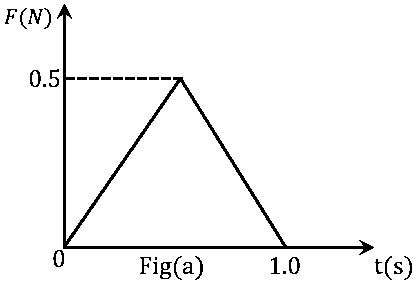
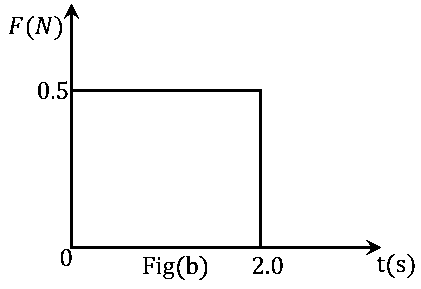
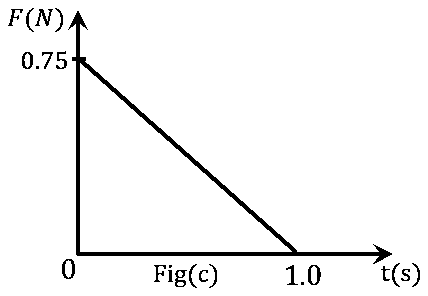
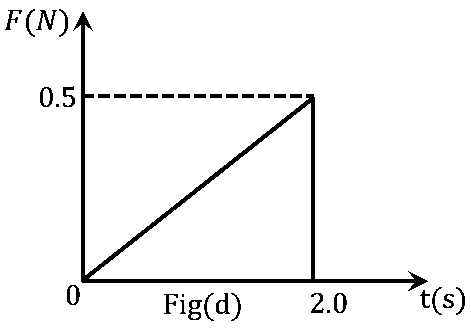
The impulse is highest in figure.
Options:
Answer:
B
Solution:
As we know, impulse is the area under the curve of the force vs. time graph. So, analysing each figure area under curve.
From above calculations, area under curve in figure (b) is maximum. Thus, fig (b) impulse is highest.
Stream:JEESubject:PhysicsTopic:Center of MassSubtopic:Impulse momentum theorem
⏱ 2mℹ️ Source: PYQ_2023
Doubts & Discussion
Loading discussions...
