
Botany - Biodiversity and its Conservation Question with Solution | TestHub
BotanyBiodiversity and its ConservationPatterns of BiodiversityEasy2 minPYQ_2020
BotanyEasysingle choice
In the plot of the species-area relationship for the co-efficient z, the axis X and Y, represents
Options:
Answer:
B
Solution:
Biodiversity includes all the flora and fauna on Earth. All the varieties of organisms come under biodiversity. German naturalist Alexander von Humboldt made the observation regarding the relationship between species richness and the area of the habitat. As per his observation, species richness increased with increasing area of habitat upto a limit. When plotted in a graph with area on x-axis and species richness on y-axis, this relationship forms a rectangular hyperbola. On a log scale, the relationship is a straight line having the equation. S=species richness, A=area of region, C=Y-intercept and Z= regression co-efficient (Slope).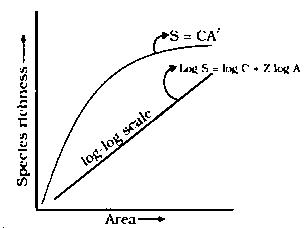
Stream:NTA_ABHYAS_NEETSubject:BotanyTopic:Biodiversity and its ConservationSubtopic:Patterns of Biodiversity
⏱ 2mℹ️ Source: PYQ_2020
Doubts & Discussion
Loading discussions...
